
Introduction to Statistics and Data Science
A moderndive into R and the tidyverse
February 14, 2020
Preface
Please note that this is a “development version” of this book for the new design of STAT 202. Meaning this is a work in progress being edited and updated as we go.
We would appreciate any feedback on typos and errors.
Help! I’m new to R and RStudio and I need to learn about them! However, I’m completely new to coding! What do I do?

If you’re asking yourself this question, then you’ve come to the right place! Start with our “Introduction for Students”.
Introduction for students
This book assumes no prerequisites: no algebra, no calculus, and no prior programming/coding experience. This is intended to be a gentle introduction to the practice of analyzing data and answering questions using data the way statisticians, data scientists, data journalists, and other researchers would.
In Figure 0.1 we present a flowchart of what you’ll cover in this book. You’ll first get started with data in Chapter 1, where you’ll learn about the difference between R and RStudio, start coding in R, understand what R packages are, and explore your first dataset: all domestic departure flights from a New York City airport in 2013. Then
- Data Exploration: You’ll assemble your data science toolbox using
tidyversepackages. In particular: - Data Modeling: Using these data science tools, you’ll start performing data modeling. In particular:
- Statistical Theory: Now you’ll learn about the role of randomization in making inferences and the general frameworks used to make inferences in statistics. In particular:
- Statistical Inference: You’ll learn to combine your newly acquired data analysis and modeling skills with statistical theory to make inferences. In particular:
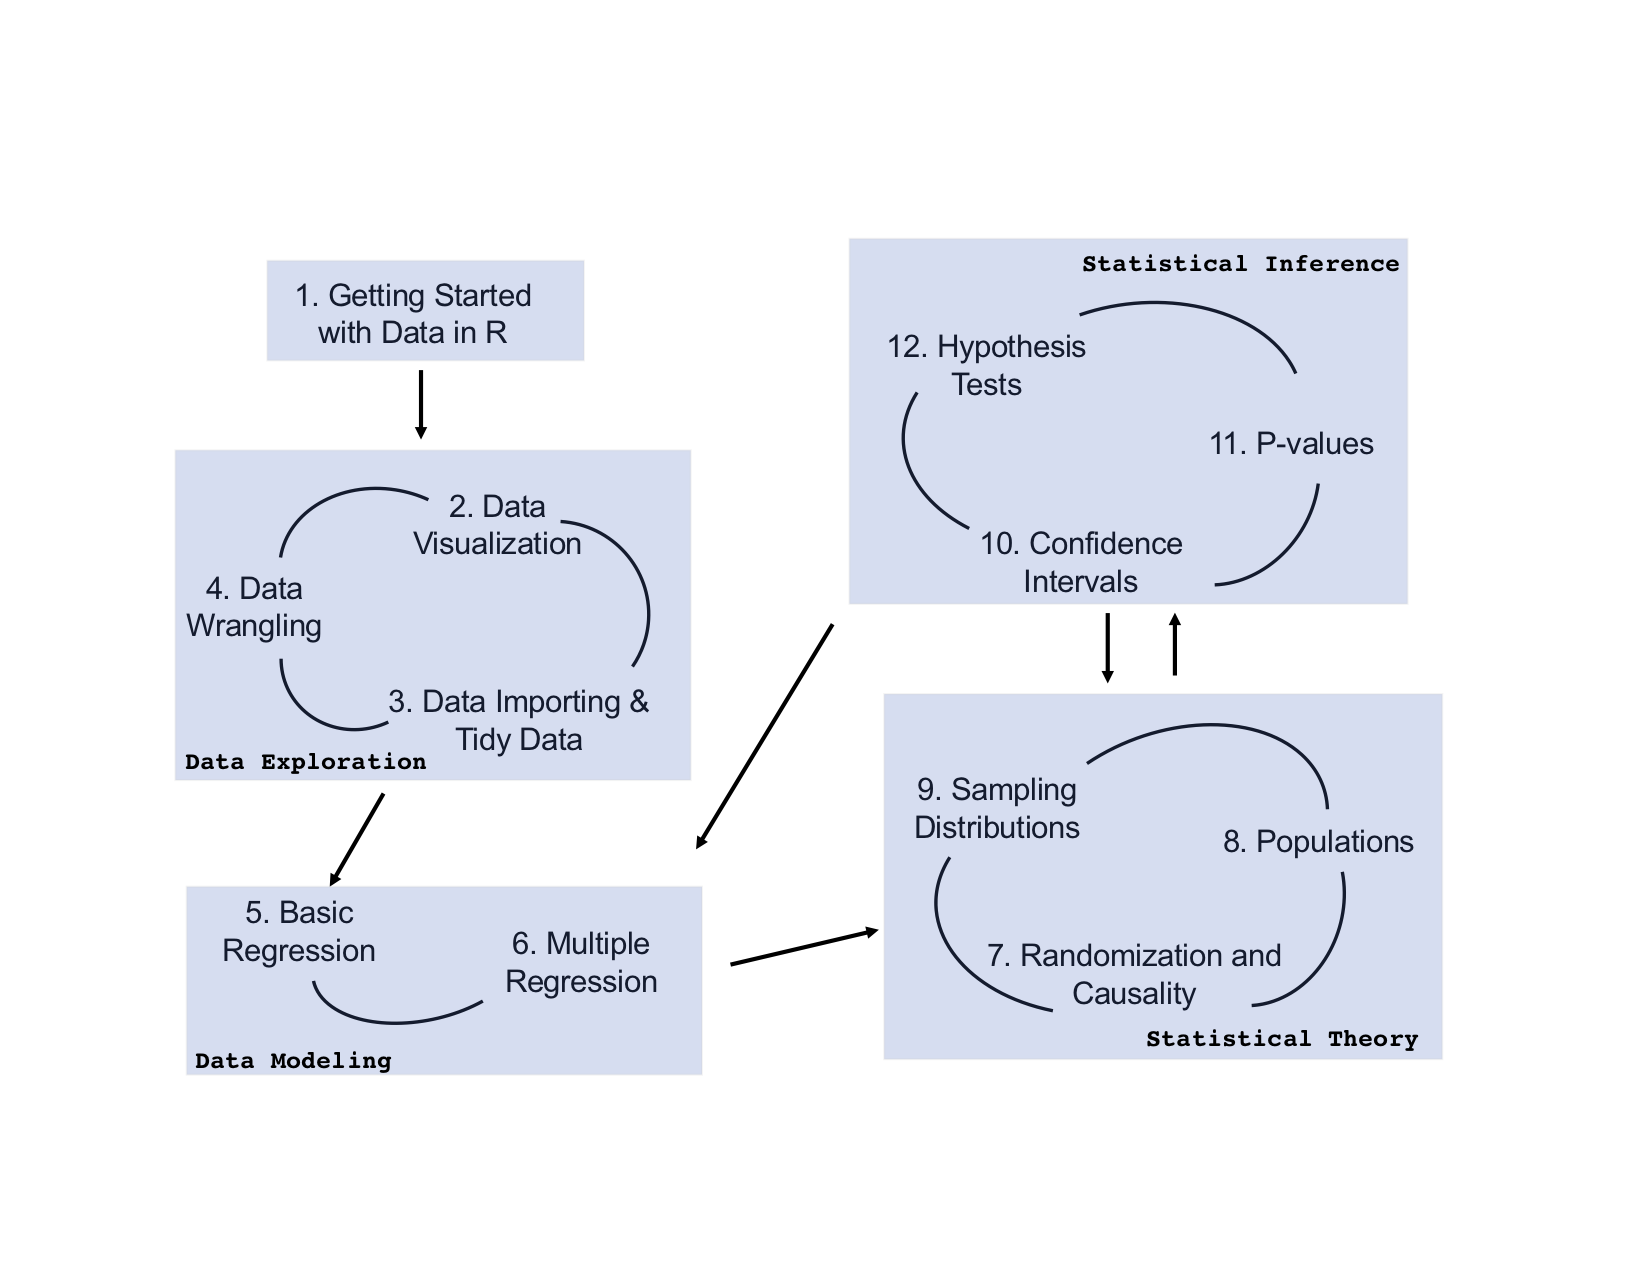
FIGURE 0.1: Course Flowchart
What you will learn from this book
We hope that by the end of this book, you’ll have learned
- How to use R to explore data.
- How to generate research questions and hypotheses.
- How to think like a statistician and the role of chance in your data.
- How to answer statistical questions using tools like confidence intervals and hypothesis tests.
- How to effectively create “data stories” using these tools.
What do we mean by data stories? We mean any analysis involving data that engages the reader in answering questions with careful visuals and thoughtful discussion, such as How strong is the relationship between per capita income and crime in Chicago neighborhoods? and How many f**ks does Quentin Tarantino give (as measured by the amount of swearing in his films)?. Further discussions on data stories can be found in this Think With Google article.
For other examples of data stories constructed by students like yourselves, look at the final projects for two courses that have previously used a version of this book:
- Middlebury College MATH 116 Introduction to Statistical and Data Sciences using student collected data.
- Pacific University SOC 301 Social Statistics using data from the fivethirtyeight R package.
This book will help you develop your “data science toolbox”, including tools such as data visualization, data formatting, data wrangling, and data modeling using regression. With these tools, you’ll be able to perform the entirety of the “data/science pipeline” while building data communication skills.
In particular, this book will lean heavily on data visualization. In today’s world, we are bombarded with graphics that attempt to convey ideas. We will explore what makes a good graphic and what the standard ways are to convey relationships with data. You’ll also see the use of visualization to introduce concepts like mean, median, standard deviation, distributions, etc. In general, we’ll use visualization as a way of building almost all of the ideas in this book.
To impart the statistical lessons in this book, we have intentionally minimized the number of mathematical formulas used and instead have focused on developing a conceptual understanding via data visualization, statistical computing, and simulations. We hope this is a more intuitive experience than the way statistics has traditionally been taught in the past and how it is commonly perceived.
Finally, you’ll learn the importance of literate programming. By this we mean you’ll learn how to write code that is useful not just for a computer to execute but also for readers to understand exactly what your analysis is doing and how you did it. This is part of a greater effort to encourage reproducible research (see subsection Reproducible reseach for more details). Hal Abelson coined the phrase that we will follow throughout this book:
“Programs must be written for people to read, and only incidentally for machines to execute.”
We understand that there may be challenging moments as you learn to program. We still continue to struggle and find ourselves often using web searches to find answers and reach out to colleagues for help. In the long run though, we all can solve problems faster and more elegantly via programming. We wrote this book as our way to help you get started and you should know that there is a huge community of R users that are always happy to help everyone along as well. This community exists in particular on the internet on various forums and websites such as stackoverflow.com.
Data/science pipeline
You may think of statistics as just being a bunch of numbers. We commonly hear the phrase “statistician” when listening to broadcasts of sporting events. Statistics (in particular, data analysis), in addition to describing numbers like with baseball batting averages, plays a vital role in all of the sciences. You’ll commonly hear the phrase “statistically significant” thrown around in the media. You’ll see articles that say “Science now shows that chocolate is good for you.” Underpinning these claims is data analysis and a theoretical model relating the data collected in a sample to a larger population. By the end of this book, you’ll be able to better understand whether these claims should be trusted or whether we should be wary. Inside data analysis are many sub-fields that we will discuss throughout this book (though not necessarily in this order):
- data collection
- data wrangling
- data visualization
- data modeling
- statistical inference
- correlation and regression
- interpretation of results
- data communication/storytelling
These sub-fields are summarized in what Grolemund and Wickham term the “Data/Science Pipeline” in Figure 0.2.
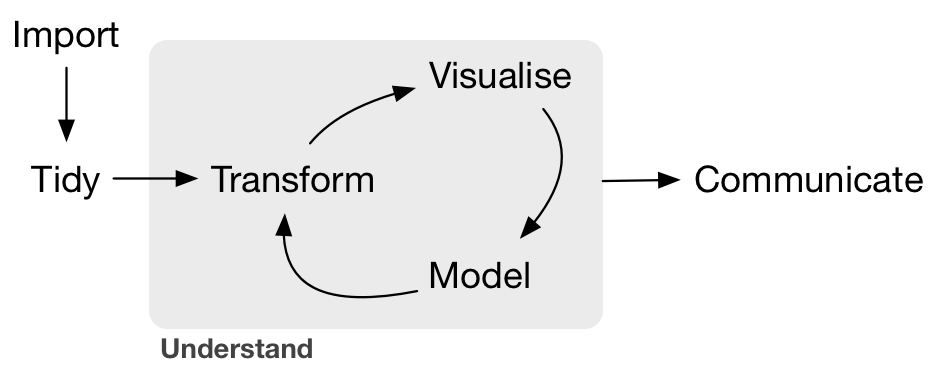
FIGURE 0.2: Data/Science Pipeline
We will begin by digging into the gray Understand portion of the cycle with data visualization, then with a discussion on what is meant by tidy data and data wrangling, and then conclude by talking about interpreting and discussing the results of our models via Communication. These steps are vital to any statistical analysis. But why should you care about statistics? “Why did they make me take this class?”
There’s a reason so many fields require a statistics course. Scientific knowledge grows through an understanding of statistical significance and data analysis. You needn’t be intimidated by statistics. It’s not the beast that it used to be and, paired with computation, you’ll see how reproducible research in the sciences particularly increases scientific knowledge.
Reproducible research
“The most important tool is the mindset, when starting, that the end product will be reproducible.” – Keith Baggerly
Another goal of this book is to help readers understand the importance of reproducible analyses. The hope is to get readers into the habit of making their analyses reproducible from the very beginning. This means we’ll be trying to help you build new habits. This will take practice and be difficult at times. You’ll see just why it is so important for you to keep track of your code and well-document it to help yourself later and any potential collaborators as well.
Copying and pasting results from one program into a word processor is not the way that efficient and effective scientific research is conducted. It’s much more important for time to be spent on data collection and data analysis and not on copying and pasting plots back and forth across a variety of programs.
In a traditional analysis if an error was made with the original data, we’d need to step through the entire process again: recreate the plots and copy and paste all of the new plots and our statistical analysis into your document. This is error prone and a frustrating use of time. We’ll see how to use R Markdown to get away from this tedious activity so that we can spend more time doing science.
“We are talking about computational reproducibility.” - Yihui Xie
Reproducibility means a lot of things in terms of different scientific fields. Are experiments conducted in a way that another researcher could follow the steps and get similar results? In this book, we will focus on what is known as computational reproducibility. This refers to being able to pass all of one’s data analysis, data-sets, and conclusions to someone else and have them get exactly the same results on their machine. This allows for time to be spent interpreting results and considering assumptions instead of the more error prone way of starting from scratch or following a list of steps that may be different from machine to machine.